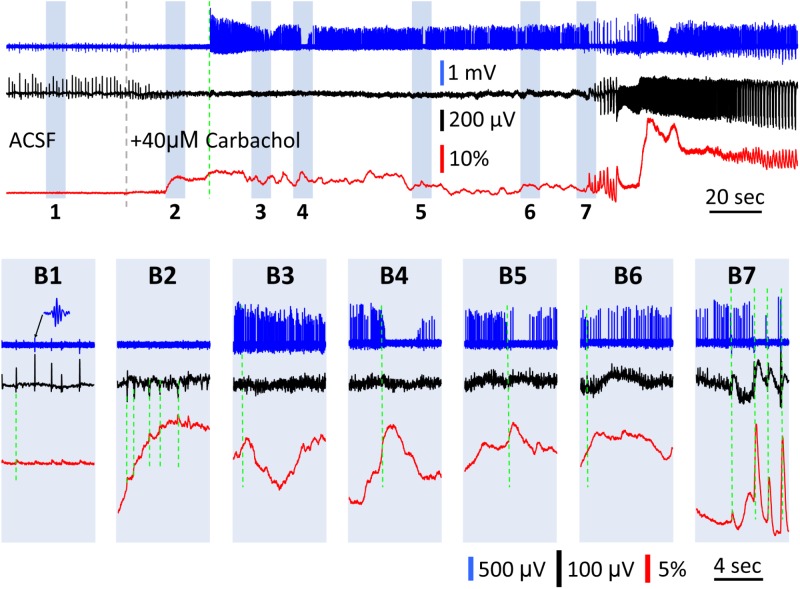
FIGURE 6.
GCaMP signals during the transition between SWs and carbachol induced bursts. (A) A 5 min recording of the transition period between spontaneous SWs and carbachol-induced theta oscillations. Blue trace shows the LFP filtered between 60–1,500 Hz (data sampled at 3,000 Hz), to isolate neuronal spikes from nearby cells. Black trace shows the LFP filtered between 0.1–30 Hz to isolate SWs (initial period) and theta bursts (final period). Red trace shows the GCaMP signal filtered between 0.1–30 Hz. Gray broken line marks the onset of 40 μM carbachol perfusion. Green broken line marks the onset of high spiking activity in the filtered blue trace. Particular periods of interest highlighted 1–7 to display on expanded time scale in panels (B). (B1) Spontaneous SWs with coincident low amplitude GCaMP peaks (green dashed line) and nested ripple oscillations (inset) before carbachol administration. After carbachol administration, the GCaMP signal had slow and large fluctuations up to ΔF/F = 30%, or about 40 times the SW signals (B2–B6). (B2) A period showing one-to-one correlations between observed peaks in the GCaMP and LFP signals (green dashed lines). (B3–B6) Periods showing minimal correlation between LFP and GCaMP fluctuations (comparing black and red traces, green dashed line marks onset of GCaMP peaks). (B4,B5) Periods showing anti-correlation between spiking rate and GCaMP fluctuations (comparing blue and red traces, green dashed line marks onset of GCaMP peaks). (B7) Onset of theta oscillations, showing large GCaMP peaks, high correlations between LFP and GCaMP, and synchronous bursts of spikes.

