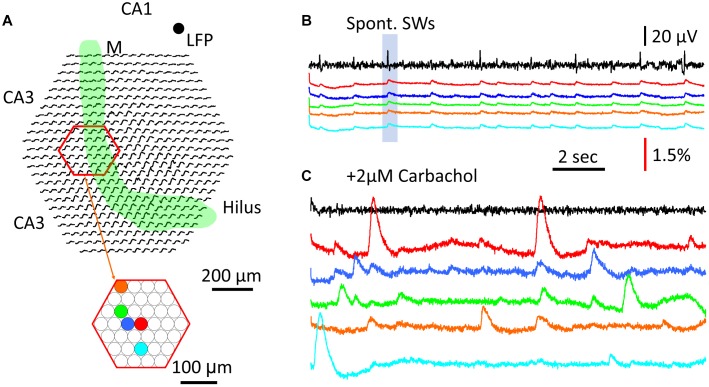
FIGURE 7.
Comparison between cellular transients and population GCaMP signal. (A) Schematic diagram of the imaging field. Green band marks the mossy fiber bundle. Red hexagon marks a subset of optical detectors imaging the CA3 pyramidal cell layer. Color dots mark five individual optical detectors; signals on these detectors are displayed in the color traces in panels (B,C). (B) Traces of LFP (black) and GCaMP (colors) signals during SW events. LFP was recorded from a location in CA1, marked by the black dot on the top right of panel (A). Color traces were from optical detectors (color dots in panel A). Blue box marks the particular SW event with optical recordings from the all detectors (black traces in the imaging field in panel A), demonstrating that a large fraction of optical detectors around the mossy fiber bundle show SW signals. (C) Cellular Ca2+ transients recorded from individual detectors in the CA3 pyramidal layer. Color traces are from the same detectors in panels (A). The signals in panels (B,C) were from the same tissue, during normal ACSF and 2 μM carbachol, respectively, a low concentration to promote activity but insufficient to induce theta busts. Note that the cellular Ca2+ transients were often localized to individual detectors, and of high amplitude and longer duration than the population SW signals in panels (A,B).

