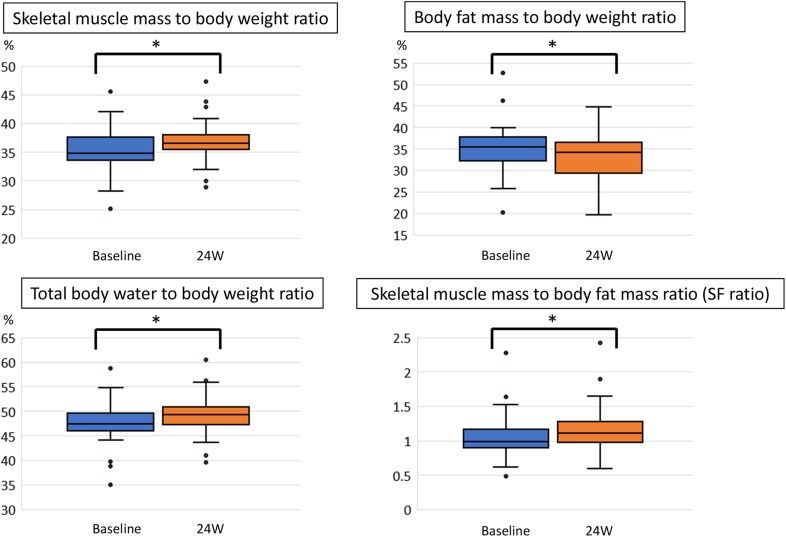
Fig. 3.
Skeletal muscle mass to body weight ratio, body fat mass to body weight ratio, total body water to body weight ratio, and skeletal muscle mass to body fat mass ratio (SF ratio) before and after 24 weeks (W) of sodium glucose co-transporter 2 inhibitor treatment. Data are presented as box-and-whisker plots and expressed as a median with the interquartile range and maximum and minimum values. Dots represent outliers defined as values exceeding the 75th percentile plus 1.5 times the interquartile range. *p < 0.01 (Wilcoxon signed-rank test)

