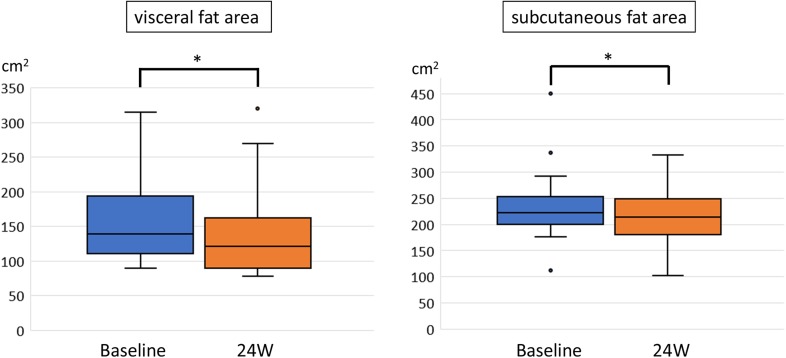
Fig. 4.
Visceral and subcutaneous fat areas measured by computed tomography scans before and after 24 weeks (W) of sodium glucose co-transporter 2 inhibitors treatment. Data are presented as box-and-whisker plots and expressed as a median with the interquartile range and maximum and minimum values. Dots represent outliers defined as values exceeding the 75th percentile plus 1.5 times the interquartile range. *p < 0.01 (Wilcoxon signed-rank test)

