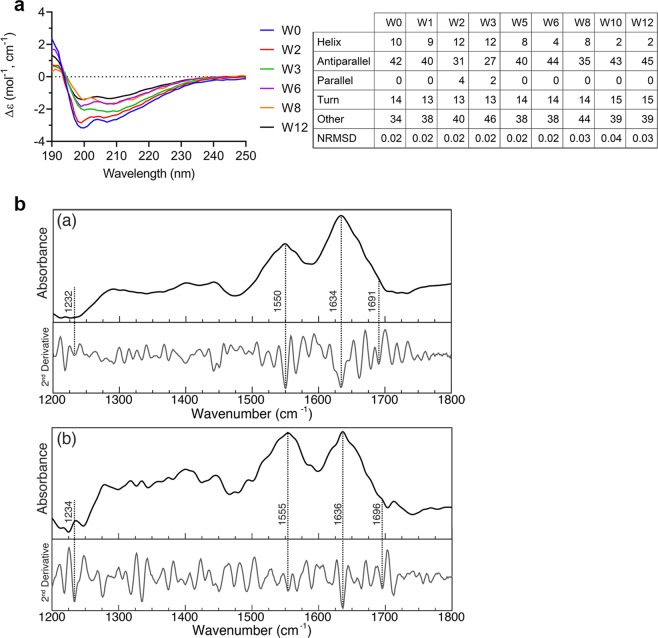
Figure 3.
CRES structural conversion involves α-helix to antiparallel β-sheet transition. (a) CD was performed approximately once a week for 12 weeks (W0-W12) on the same sample of mid-concentration CRES (6.6 mg/ml) in 4 mM potassium phosphate buffer, pH 7.4. Samples were diluted to 0.17 mg/ml and spectra immediately collected. Spectral curves show experimental data. Secondary structure predictions were done using the BeStSel server28. NRMSD, normalized root mean square deviation. (b) ATR-FTIR was performed on mid- and high concentration CRES samples after incubation in 4 mM potassium phosphate buffer, pH 7.4 for 2 weeks at 4 °C. Samples were diluted to 0.17–0.21 mg/ml immediately before collection of spectra. (a), mid-concentration CRES (6.4 mg/ml); (b), high concentration CRES (15 mg/ml). Second derivative spectra are included.

