Figure 4.
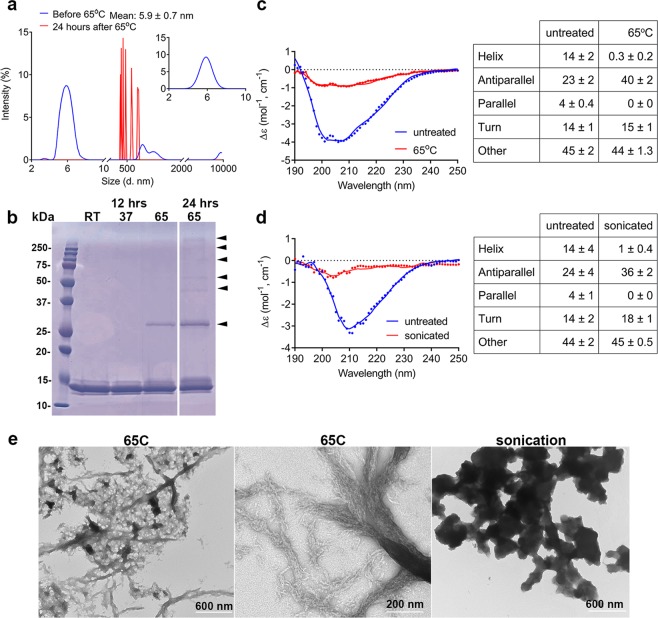
Thermal and mechanical stress promote CRES amyloidogenesis. Freshly prepared CRES was exchanged into 4 mM potassium phosphate buffer, pH 7.4 and analyzed by (a) DLS and (c) CD before (blue) and after (red) heating at 65 °C for 24 hours. CD spectral curve shows experimental (dotted line) and fitted data (solid line) from a representative experiment. Table shows the mean ± SEM of n = 5 replicates using 3 independent CRES preparations. (b) Coomassie Blue stained SDS-PAGE of 0.26 mg/ml CRES in high salt gel filtration buffer incubated at room temperature, 37 °C and 65 °C for 12 hours and 24 hours. (d) CRES in 12.5 mM MES, 25 mM HEPES, pH 7.4 was concentrated and sonicated as described in Methods. The sample was diluted to 0.16 mg/ml for CD analysis. The untreated control sample was 0.14 mg/ml CRES in 25 mM MES. CD spectral curve shows experimental (dotted line) and fitted data (solid line) before (blue) and after (red) sonication from a representative experiment. The table shows the mean ± SEM of n = 3 independent CRES preparations. (e) Negative stain TEM of CRES samples after 24 hour incubation at 65 °C or sonication. Data are representative of n = 3 experiments.

