Figure 8.
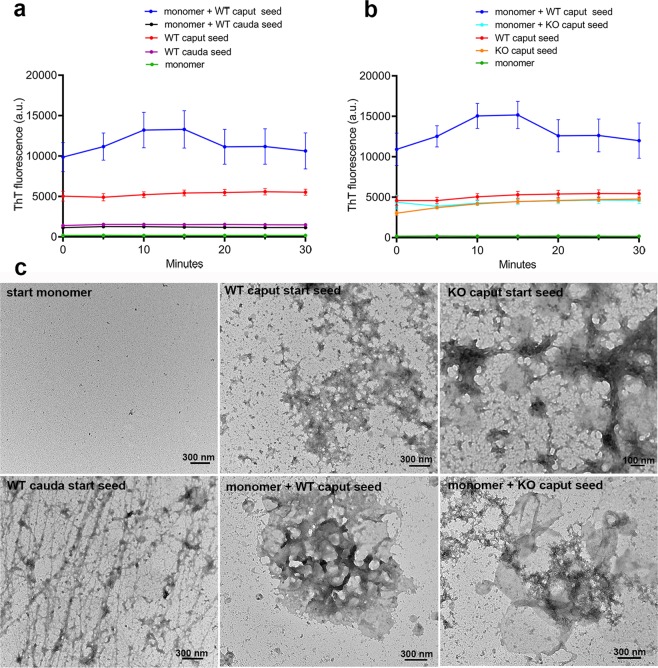
The epididymal amyloid matrix templates CRES amyloid assembly. (a) Thioflavin T fluorescence in 4.4 μM CRES monomer, 10 μg caput and cauda epididymal amyloid matrix seed isolated from wildtype (WT) mouse epididymis, and monomer and seed combined. Reactions were done in 20 μM Thioflavin T, 5.5 mM MES, 55–110 mM NaCl, 0.22 mM EDTA, and 0.68X dPBS, pH 7.4. The fluorescence was measured continuously for 30 min at 25 °C without shaking. The data show the mean ± SEM from n = 6 replicates using 3 independent epididymal amyloid matrix isolations. The error bars for monomer, WT cauda seed, and monomer +WT cauda seed are too small to be detected. (b) Thioflavin T fluorescence in 4.4 μM CRES monomer, 10 μg caput amyloid matrix seed isolated from WT and CRES KO epididymis, and monomer and seed combined. The ThT data for the WT caput samples are the same as that presented in (a) but with one additional replicate. Data are presented in two graphs for clarity. Data show the mean ± SEM from n = 7 replicates using 3 independent epididymal amyloid matrix isolations. The error bars for monomer are too small to be detected. (c) Negative stain TEM of structures present in starting monomer, caput and cauda seeds, and seeded reactions from WT and KO samples. Additional TEM images are in Supplementary Fig. S10.

