
Fig. 3. The genetic architecture of longevity.
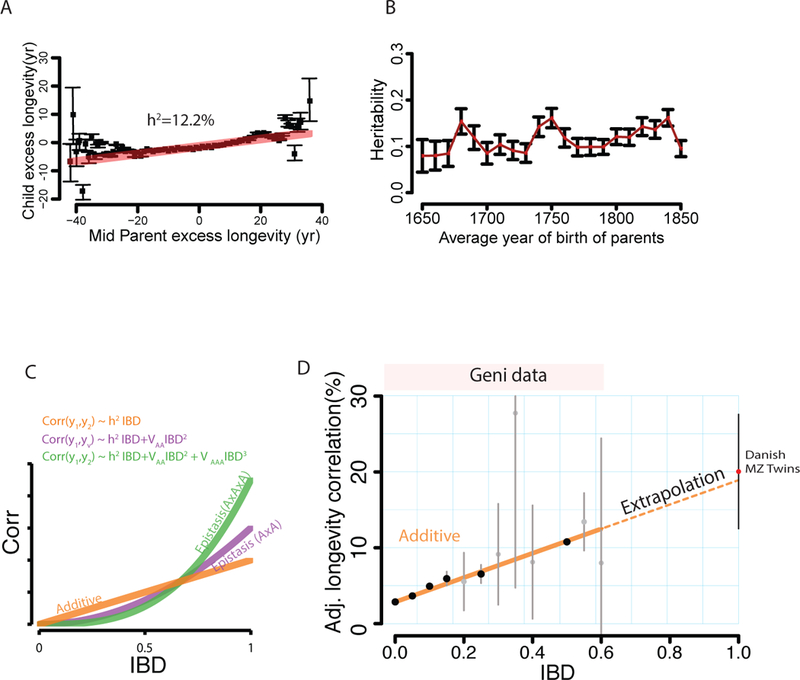
(A) The regression (red) of child longevity on its mid-parent longevity (defined as difference of age of death from the expected lifespan). Black: the average longevity of children binned by the mid-parent value. Gray: estimated 95% confidence intervals (B) The estimated narrow-sense heritability (red squares) with 95% confidence intervals (black bars) obtained by the mid-parent design stratified by the average decade of birth of the parents (C) The correlation of a trait as a function of IBD under strict additive (h2, orange), squared (VAA, purple), and cubic (VAAA, green) epistasis architectures after dormancy adjustments (D) The average longevity correlation as a function of IBD (black circles) grouped in 5% increments (gray: 95% CI) after adjusting for dominancy. Dotted line: the extrapolation of the models towards MZ twins from the Danish Twin Registry (red circle).