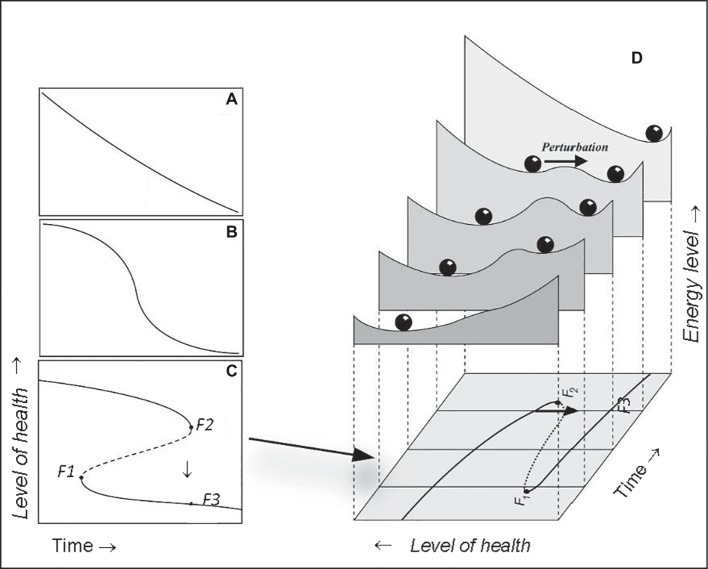
Figure 1.
Catastrophic bifurcations in human physiology are illustrated by the well-known fold catastrophe (left hand panels). Although some systems respond smoothly (A) over time, change can also be relatively sharp over time in the equilibrium curve, which reflects the response of the organ or individual around some threshold condition (B). The situation in which critical transitions can occur arises if this equilibrium curve is “folded” (C). Then three equilibria can exist for a given condition. If the system is very close to a bifurcation point (i.e., F2) a tiny change in the condition, may cause a large shift in health state to the lower branch [F3 in (C)]. Close to such a bifurcation a perturbation [arrow in right hand graph (D)] can easily push the system across the boundary between the attraction basins, as illustrated by the stability landscapes in the right hand graph. Subjects may then suddenly shift from one to another health state and energy level. The likelihood of such a sudden change over time differs with the system’s resilience: least resilient close to the tipping point (landscape slide with arrow) more resilience moving away from this point (F2), backward and forward (so non-linear). When the route would be started from the right hand side [at F3 in (C,D)] backwards, the way up would lead to point F1, and therefore would be different from the way down (via F2). This shows that bifurcation points are passed differently coming from different directions. In human physiology this is resembled by the fact that the recovery route differs from the route of acutely falling ill.

