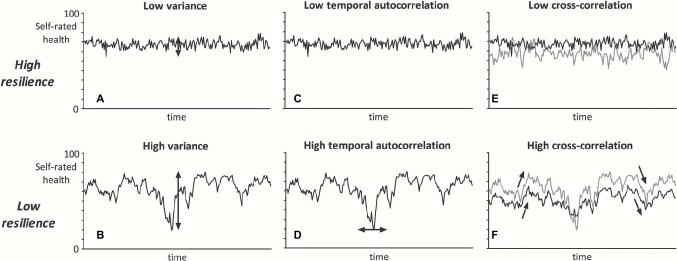
Figure 2.
Graphical illustration of the dynamical resilience indicators. If a person has low systemic resilience, fluctuations of self-rated health over time are hypothesized to show higher variance (A vs. B), higher temporal autocorrelation (C vs. D), and higher cross-correlation between self-rated health domains (E vs. F). In this example of fluctuations of self-rated health (data were randomly induced with a model), the black line may represent physical health and the gray line mental health (Gijzel et al., 2017).

