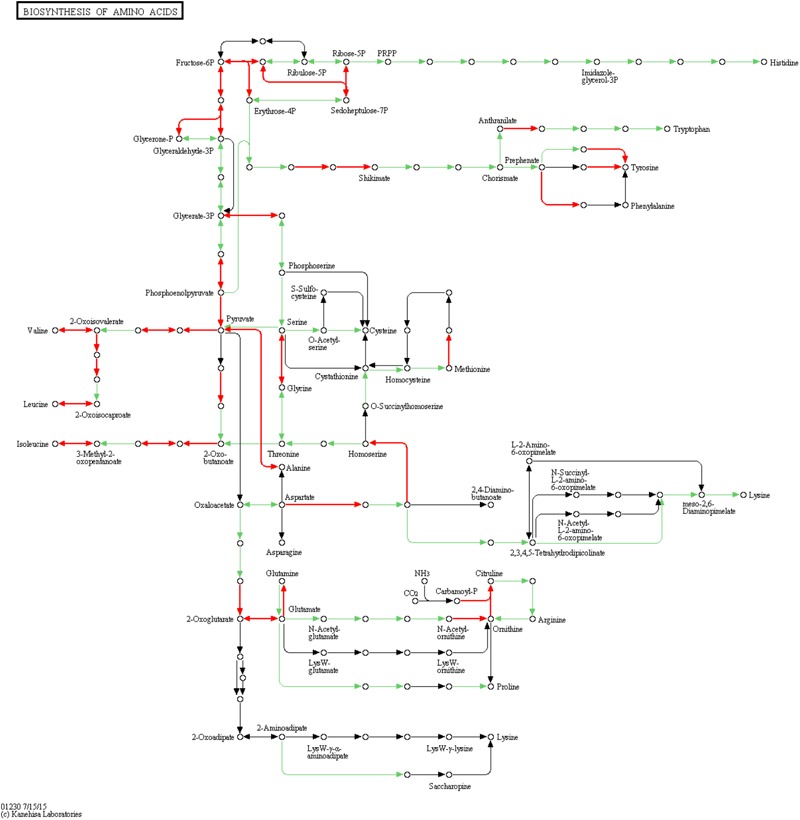
FIGURE 6.

Schematic diagram of amino acid biosynthesis pathway. Diagram constructed using KEGG pathway analysis. Circles represent metabolites, and arrows indicate steps. Red arrows indicate steps catalyzed by DEGs.

Schematic diagram of amino acid biosynthesis pathway. Diagram constructed using KEGG pathway analysis. Circles represent metabolites, and arrows indicate steps. Red arrows indicate steps catalyzed by DEGs.