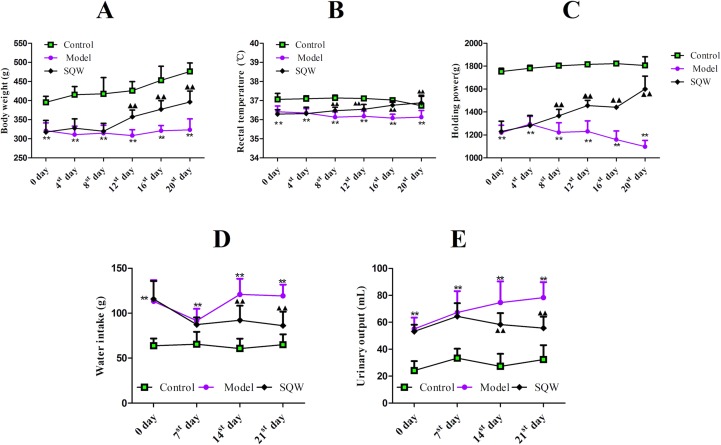
Figure 6.
Effects of SQW on body weight (A), rectal temperature (B), holding power (C), water intake (D), and urinary output (E) in rats. **p < 0.01, the model group (n = 10) versus the control group (n = 10). ▲▲ p < 0.01, the SQW group (n = 10) versus the model group (n = 10). Values are presented as the means ± SD. The p-values were calculated using a one-way ANOVA.

