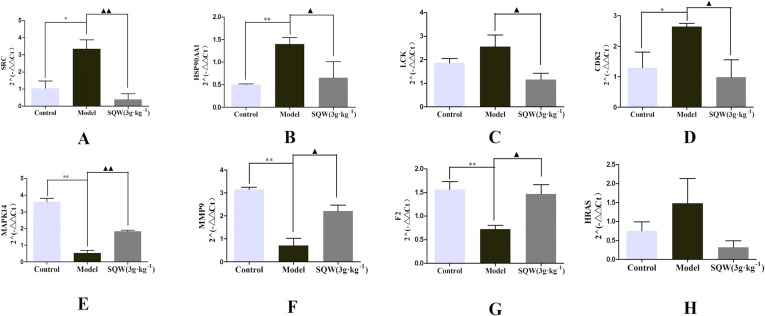
Figure 7.
The effects of the control, KYDS model, and SQW treatments (3 g/kg/day) on SRC (A), HSP90AA1 (B), LCK (C), CDK2 (D), MAPK14 (E), MMP9 (F), F2 (G), HRAS (H) mRNA expression in the kidney. Values are expressed as mean values ± SD. **p < 0.01 or *p < 0.05 compared with the control group; ▲▲ p < 0.01 or ▲ p < 0.05 compared with the model group.

