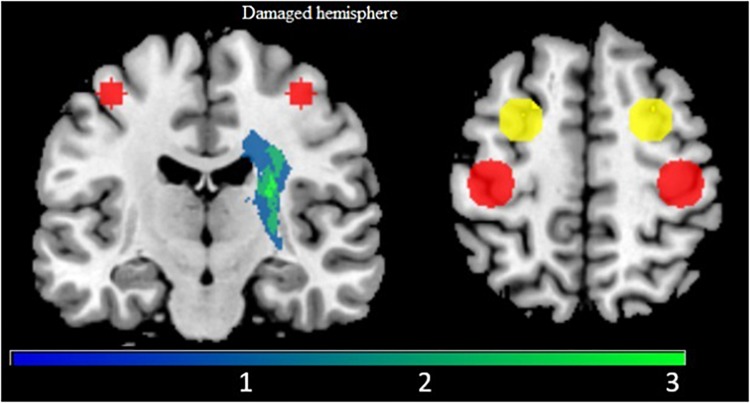
FIGURE 3.
Lesion map does not overlap with cortical motor areas. Display of the lesion map (blue to green scale, with green indicating greater overlap across participants) with regions of interest for M1 (red) and PMd (Yellow). The M1 and PMd ROIs are used in ROI-to-ROI analysis (section fMRI ROI-to-ROI Analysis).

