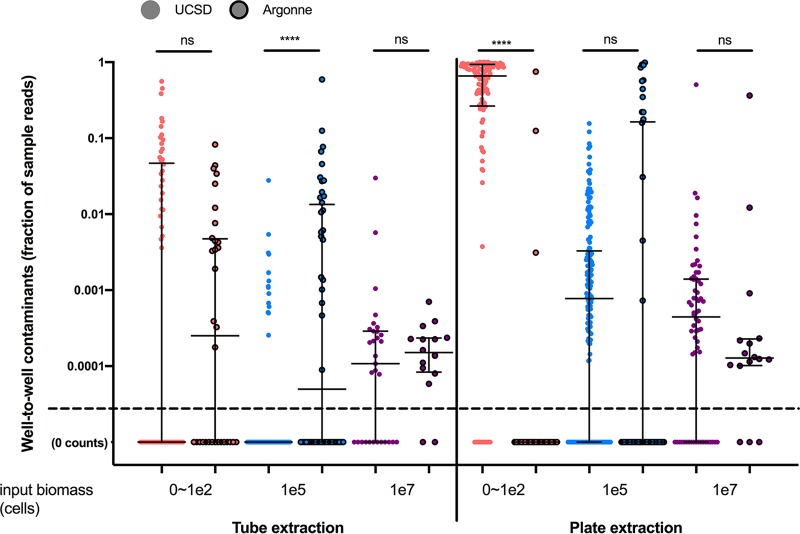
FIG 4.
Summary statistics of sample fraction compositions of well-to-well contaminants compared across extraction types (blanks [pink], sink [blue], and source [purple]) and across extraction methods (tube versus plate). The y axis has a maximum value of 1 (corresponding to 100%). Sample types (NTC, sink, or source) were assigned an estimated input biomass of 0 to 100 cells, 1e5 cells, or 1e7 cells, respectively. For UCSD tube extractions, samples from both PCR replicate plates (PCRA and PCRB) were included. For UCSD robot plate extractions, samples from both PCR replicate plates and both DNA extraction plates were combined and organized by sample type. Argonne processed samples included one extraction plate and one PCR replicate plate. Samples processed at UCSD are indicated by circles with no outline, and samples processed at Argonne are indicated by circles with a dark border. All samples with zero well-to-well contamination occurrences are given a count of 0.00001 to enable visualization on the graph (labeled 0 counts). Medians and interquartile ranges are displayed in black lines over the data points. ****, P < 0.001; ns, not significant.

