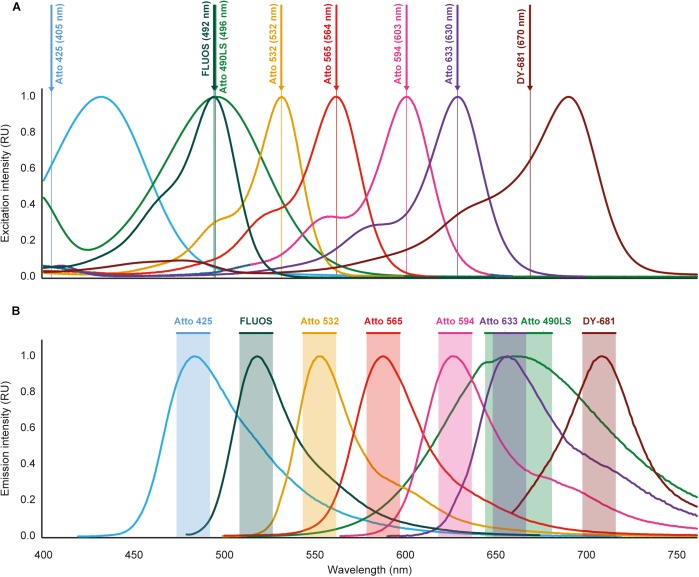
FIGURE 1.
Excitation and emission spectra of the fluorochromes used for multicolor FISH in this study. (A) Excitation spectra. Wavelengths indicated after the fluorochrome names and by vertical lines are the excitation wavelengths applied for imaging. For Atto 425 and DY-681, different wavelengths than the maxima of the excitation spectra were used because of technical limitations of the microscopy equipment. (B) Emission spectra. Shaded regions indicate the wavelength windows used for recording the fluorescence emitted by the respective dyes. The spectral properties of the fluorochromes are listed in Table 2. Please refer to Fig. S1 for an illustration that includes the spectra of the widely used dyes Cy3 and Cy5, which were not used for multicolor FISH because of overlapping spectra with several of the other fluorochromes (see text for details). RU, relative units.

