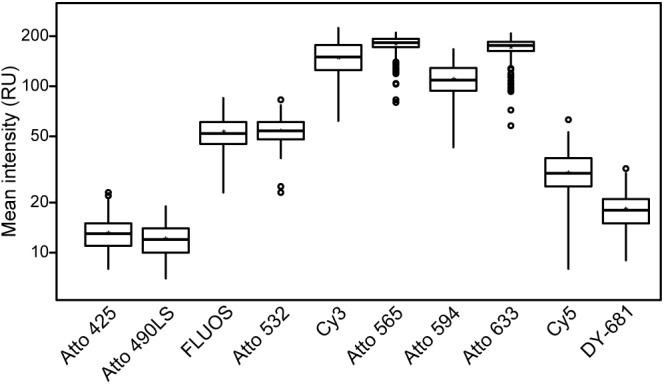
FIGURE 2.

Comparison of the fluorescence intensities of the different fluorochromes. Mean fluorescence intensities of E. coli cells after FISH using probe EUB338-I labeled with the respective fluorochrome are shown. Aside from the excitation and recording wavelengths, images were acquired using the same imaging settings to ensure comparability. Note the logarithmic scaling of the y-axis. At least 100 E. coli cells were evaluated for each fluorophore.
