
Figure 3.
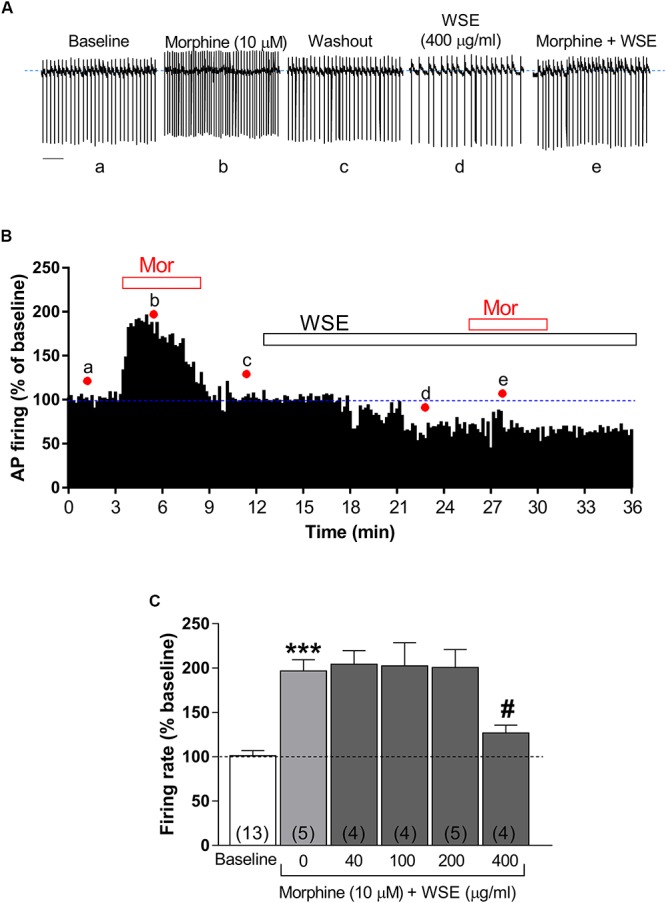
Effects of WSE on the stimulatory action of morphine on VTA DA neuron firing rate. (A) Representative traces of spontaneous firing recorded form a single DA neuron before (baseline), during and after (wash-out) the bath-application of morphine (10 μM) alone and in the presence of WSE (400 μg/ml). Scale bar: 1 s. (B) The graph shows the temporal changes of firing rate of a single VTA DA neuron during and after (wash-out) bath-application of morphine (10 μM) (Mor) alone and of morphine in the presence of WSE (400 μg/ml). Values are expressed as percent change from baseline. Points and letters indicate the correspondent section of the trace that was isolated from the whole recording and reported in panel (A). (C) The histogram graph shows the concentration–response effect of WSE on the stimulatory action of morphine on firing rate. Data are expressed as percent change from baseline and are means ± SEM. The number of cells analyzed (obtained from at least three animals per group of recordings) is indicated by the number inside each histogram. ∗∗∗P < 0.0001 vs. baseline; #P < 0.05 vs. morphine alone.