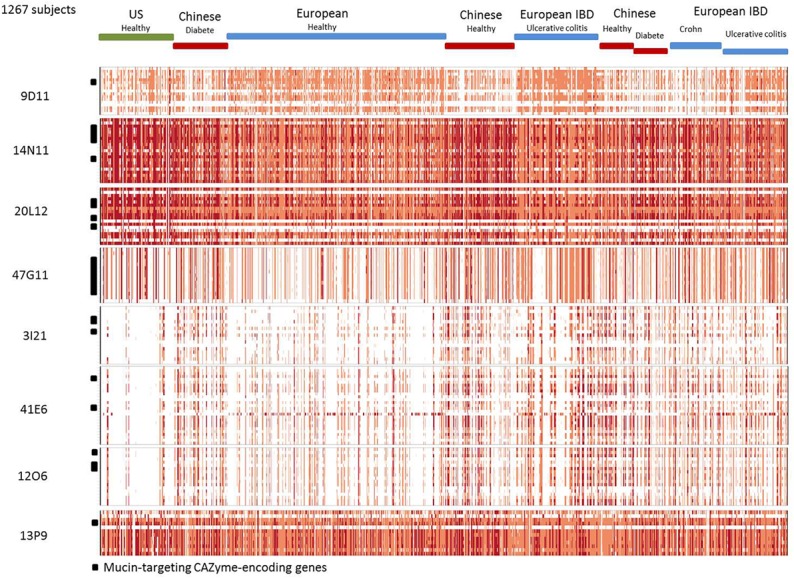
FIGURE 3.

Abundance and prevalence of the genes of the contigs in the human gut metagenome. Genes are in rows. Individuals are in columns. The normalized abundance is represented by a color scale, white, not detected; pink, orange, and red, increasing abundance with a 100-fold change between colors.
