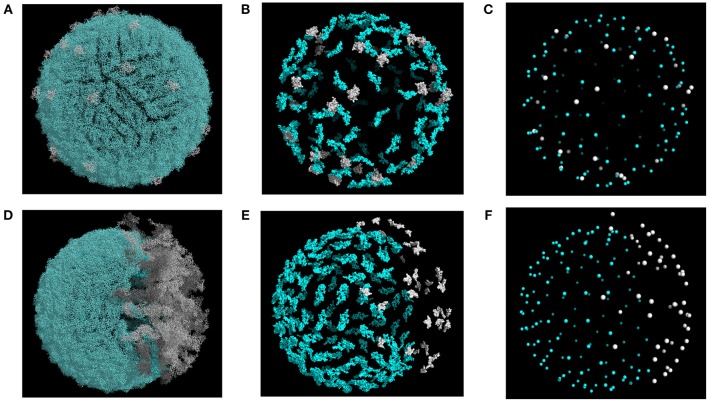
Figure 1.
Structural models of DENV envelope used for simulations. Representative structures are shown for smooth (A–C) and rough (D–F) conformations. Epitopes and epitope centers for TS (blue) and CR (white) mAbs are highlighted in (B,C,E,F). Structures were generated with maturation corresponding to a prM content of 20%.

