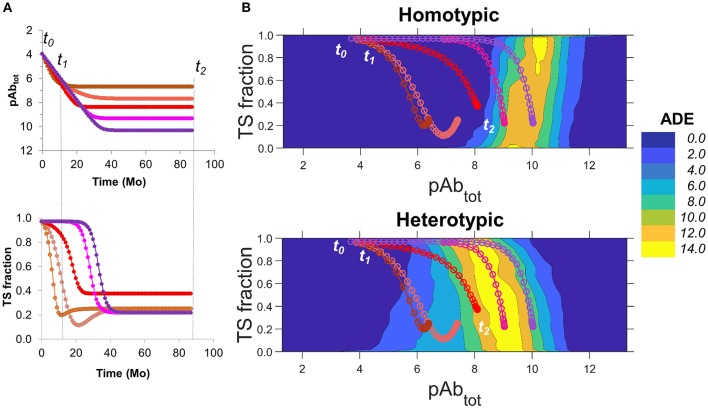
Figure 6.
Estimating the longitudinal risk of ADE from simulation data. (A) Hypothetical scenarios of changes in DENV-specific serum Ab concentration over time (top) from the convalescent phase of a primary infection (t0) to a time point where set-point titers are achieved (t2), where t1 indicates 1 year post infection. Scenarios with increasingly higher set-point titers are shown from brown to purple. The bottom panel shows the corresponding TS Ab fractions for each scenario. (B) Contour plots for ADE as a function of fine specificity, expressed as TS fraction, and total Ab concentration. Scenarios are plotted using corresponding colors in (A) for homotypic (top) and heterotypic (bottom) conditions. Plots are derived from simulations of smooth virions with a prM content of 20%.

