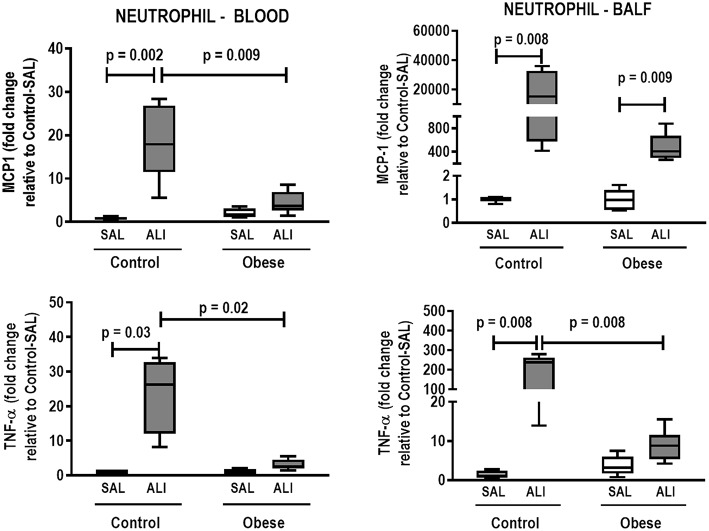
Figure 7.
Expression of biological markers. Real-time polymerase chain reaction analysis of monocyte chemoattractant protein-1 (MCP-1) and tumor necrosis factor (TNF)-α from Control and Obese animals treated with saline (SAL) or endotoxin (ALI) intratracheally. Left panel: Blood neutrophils. Right panel: BALF neutrophils. Relative gene expression was calculated as the difference in average gene expression levels compared with the reference gene 36β4 (acidic ribosomal phosphoprotein P0) and expressed as fold change relative to Control-SAL. Boxes show the interquartile range (25–75%), whiskers denote the range (minimum–maximum), and horizontal lines represent the median in nine animals/group.

