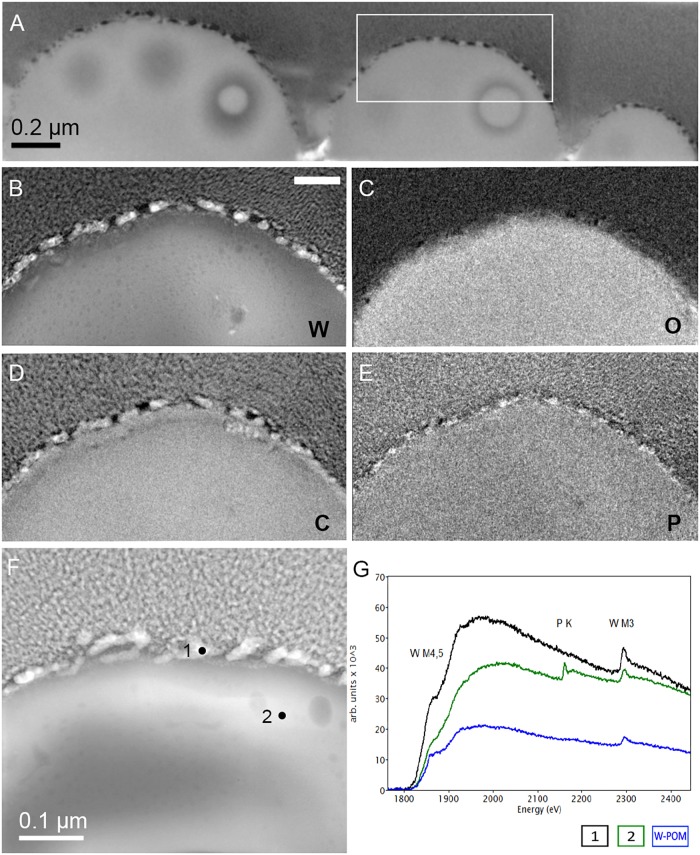
FIGURE 7.
Additional elemental ultrastructural analysis of cells of M. sedula after 21 days of cultivation with W-POM. (A) Scanning electron microscopy (SEM) image showing an assemblage of the cells of M. sedula used for transmission electron microscopy (TEM) analysis. (B) TEM image showing an assemblage of the cells of M. sedula (C,D) Corresponding carbon (C) and oxygen (O) elemental maps. (E) Magnified TEM image of a cell of M. sedula. (F,G) Corresponding tungsten (W) elemental map and overlaid image. Scale bars are 1 μm.

