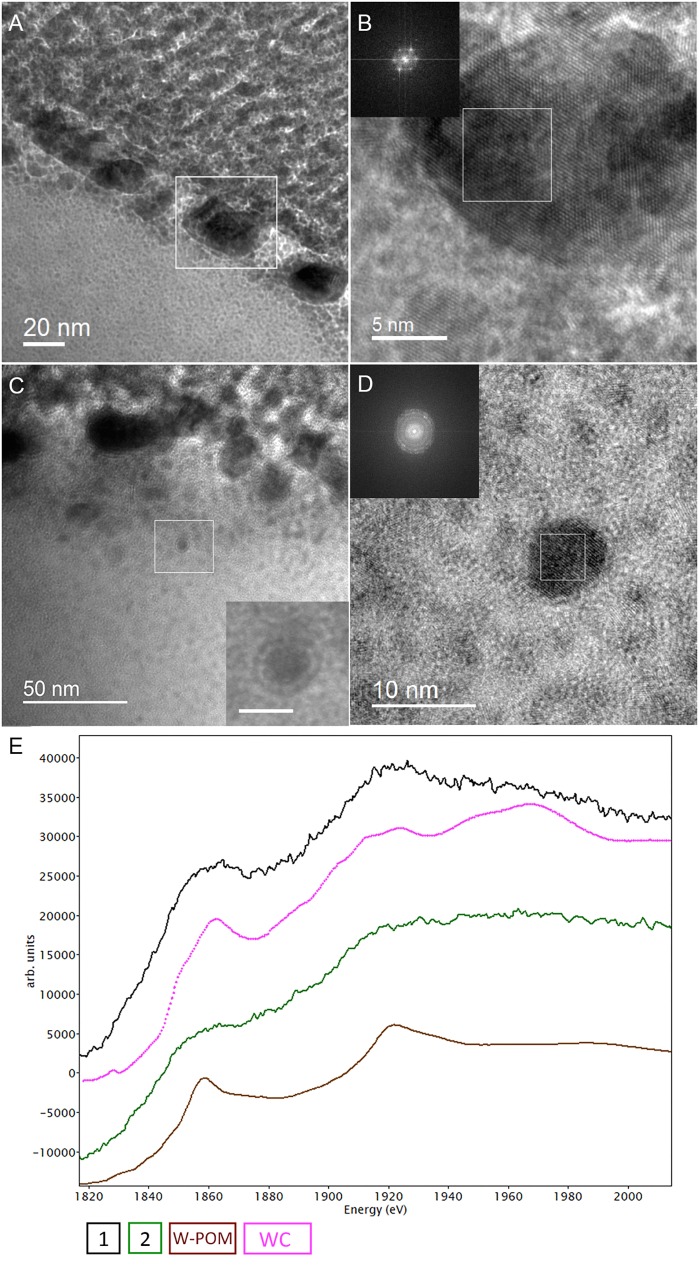
FIGURE 8.
Analytical spectroscopy of biogenic tungsten deposits in the cells of M. sedula after 21 days of cultivation with W-POM. (A) High-resolution TEM (HR-TEM) image of S-layer fragment of M. sedula cell. (B) HR-TEM and Fast Fourier Transform (FFT) acquired from the tungsten crystalline cell surface deposits labeled in panel (A). (C) HR-TEM image of the intracellular part of M. sedula cell; inlet represents magnified labeled area showing that intracellular nanoparticle is surrounded by electron dense layer which may suggest the presence of membrane; (D) HR-TEM and FFT obtained from intracellular nanoparticle labeled in panel (C). Insets in panel (B,D) represent diffraction patterns consistent with the tungsten carbide WC and W2C phases. (E) Comparison of Energy Los Near Edge Spectra (ELNES) recorded from W-M4,5 edge with the reference spectra from a WC phase (pink line) and simulations of W-containing phases of W-POM (brown line) and of the areas depicted in Figure 5F (black and green lines).

