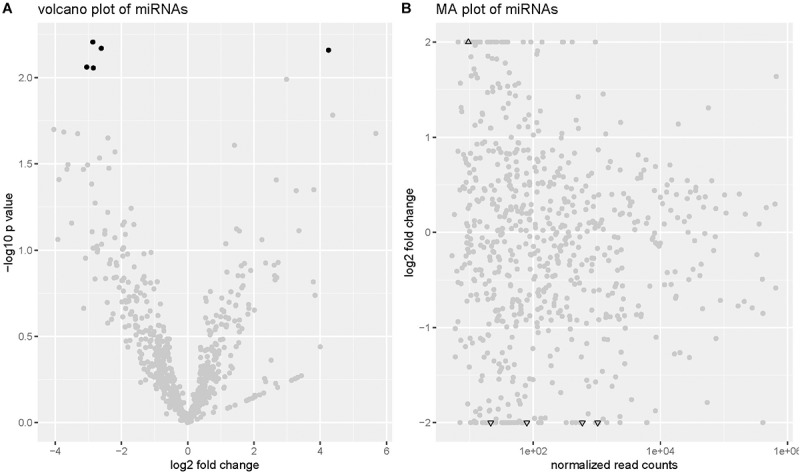
FIGURE 1.

The volcano plot and MA-plot of expressed miRNAs. (A) Volcano plot. Significantly DE miRNAs are in black. Others are in gray. (B) MA plot. When the LFC of the DE miRNAs were greater than 2 or less than –2, they were presented by black triangles on the boundary.
