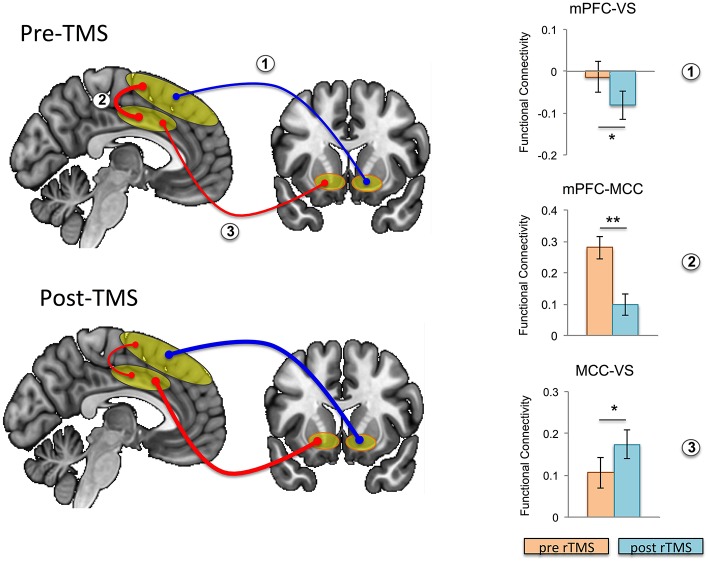
Figure 3.
Effects of repetitive transcranial magnetic stimulation (rTMS) on intrinsic functional connectivity in healthy controls. Functional connectivity is schematically illustrated at baseline (i.e., pre-rTMS; top left) and post-rTMS (bottom left); pre- and post-rTMS effects on seed-to-seed functional connectivity are shown in the bar graphs. After rTMS, functional connectivity between mesial prefrontal cortex (mPFC) and ventral striatum (VS), and between mPFC and mid cingulate cortex (MCC) was reduced, while functional connectivity between MCC and VS was increased (the thickness of the arrows correspond to strength, and color to direction: red, positive connectivity; blue, negative connectivity). Error bars are shown as standard error of the mean. *p < 0.05, **p = 0.001.

