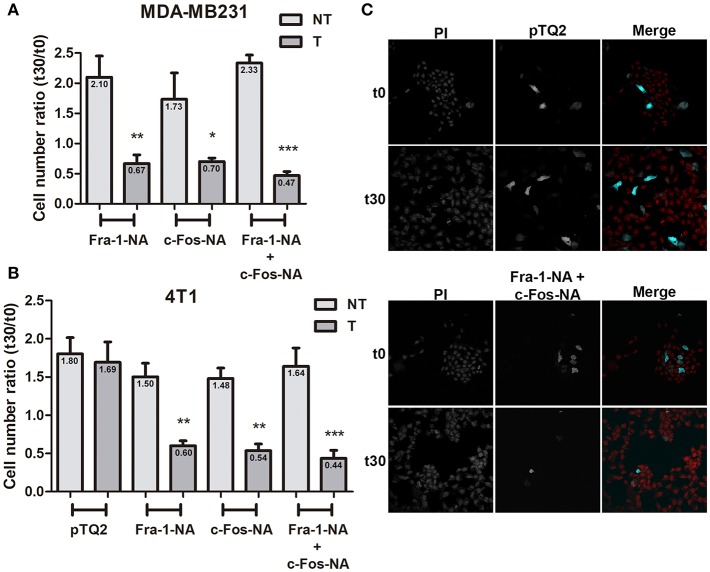
Figure 4.
Fra-1-NA and c-Fos-NA inhibit MDA-MB231 and 4T1 cell proliferation. MDA-MB231 (A) or 4T1 cells (B) were transfected to express pTQ2-Fra-1-NA, or pTQ2-c-Fos-NA, or pTQ2-c-Fos-NA + pTQ2-Fra-1-NA. The number of cells expressing the turquoise fluorescent protein (T: dark gray bars) and the number of non-transfected (NT: light gray bars) cells (propidium iodide stained cells—turquoise cells) present in the same well were counted at 0 h (arrested cells: t0) and 30 h after a mitotic stimulus (20% fetal bovine serum: t30). The ratio between the number of T or NT cells at t30 and t0 is shown and the mean indicated in each bar. Results are expressed as mean ± SEM (n = 3). *p < 0.05; **p < 0.01 ***p < 0.001 (ANOVA, Bonferroni post-test). (C) Representative images of 4T1 cells at t0 (arrested cells) and t30 (after 30 h of a mitotic stimulus) of the control condition transfected with the pTQ2 vector (upper panel) and the condition transfected with pTQ2-c-Fos-NA + pTQ2-Fra-1-NA (lower panel). Total cells stained with PI (left column), and transfected cells (middle column) are shown in black and white and the colored merge in right column. PI: propidium iodide (red), TQ2 (cyan). Original Magnification 400×.

