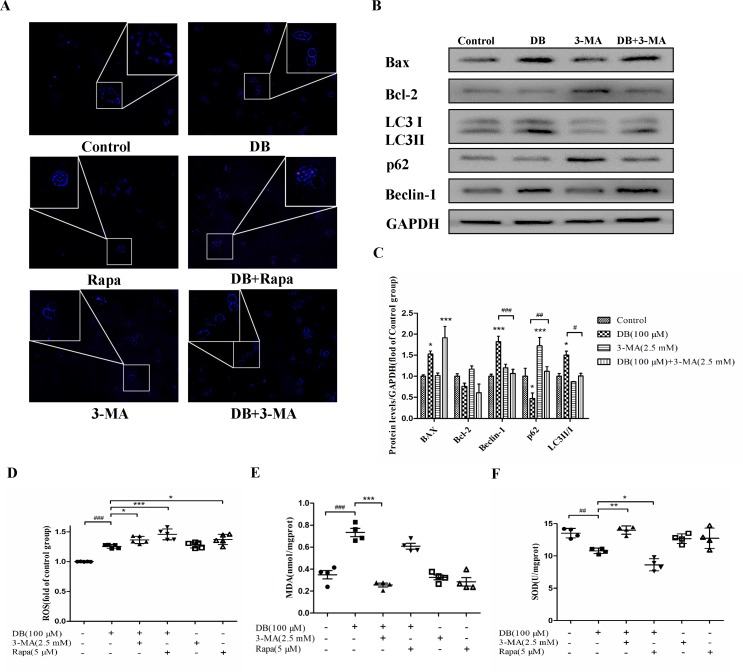
Figure 4.
Activation of autophagy regulated antioxidant capacity. Cells were divided into six groups and treated for 48 h as described in the Figure 3 caption. (A) Monodansylcadaverine (MDC) staining assay was applied to detect autophagy. (B, C) The expression of autophagy and apoptosis related proteins in the different groups. (D) The fluorescence intensity of ROS. (E, F) The levels of MDA and SOD were analyzed using a microplate reader. The results are shown as mean ± SD (n = 3) and calculated from at least three independent experiments. ***P < 0.001, **P < 0.01, *P < 0.05, compared to the control group. ### P < 0.001, compared to the DB group.

