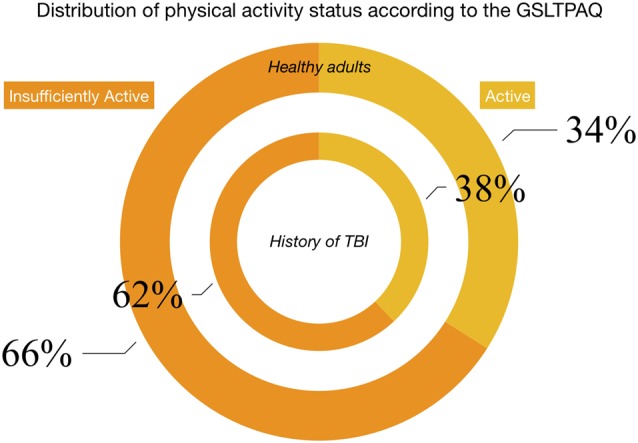
Figure 1.

Hollow pie charts show the proportion of individuals who report being active (yellow bars) compared to insufficiently active (orange bars) based on the Godin-Shepard leisure time physical activity questionnaire (GSLTPAQ). The Godin questionnaire classifies people as active or insufficiently active based on the number of times per week spent performing either moderate or strenuous physical activity of at least 15 min. The inner bars represent the group with a history of traumatic brain injury (TBI) and the outer bars represent those free from any neurological or neuropsychiatric disease. A numerically higher proportion of individuals in both groups report being insufficiently active compared to those reporting being active.
