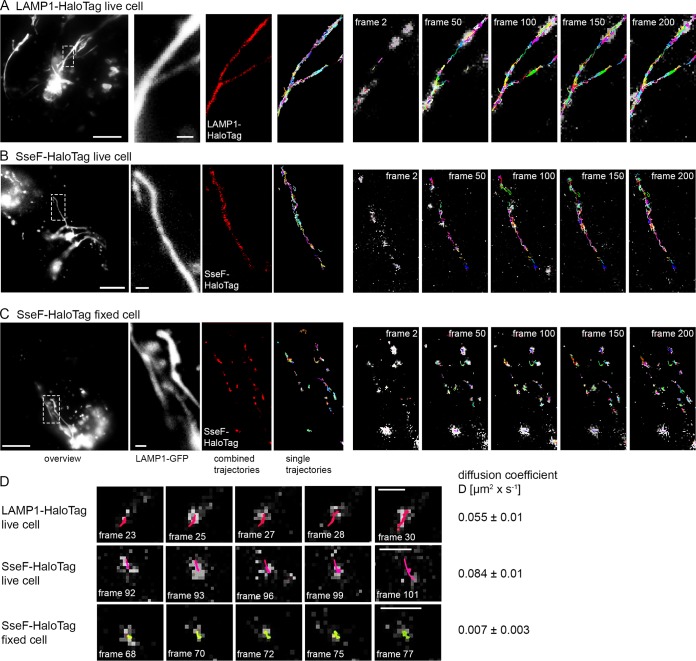
FIG 6.
Single-molecule tracking of SPI2-T3SS effector protein SseF-HaloTag and host protein LAMP1-HaloTag. (A) HeLa cells stably expressing LAMP1-meGFP were transiently transfected for expression of LAMP1::HaloTag and infected with WT STM at an MOI of 75. (B) HeLa cells stably expressing LAMP1-meGFP were infected with the STM ΔsseF strain expressing sseF::HaloTag::HA at an MOI of 75. (C) Infection was performed as for panel B, but cells were fixed. After incubation for 7 h, labeling reactions were performed directly before imaging by HTL-TMR (20 nM final concentration) for 15 min at 37°C. Live-cell imaging was performed using 15% laser power at the focal plane, and single molecule localizations, and trackings within 200 consecutive frames were analyzed. Selected frames (frame rate: 32 frames per second) of HTL-TMR signals and localization and tracking (also showing elapsed trajectories) are presented. Each trajectory has a different color. Scale bars, 10 μm (overview), 1 μm (detail). The sequences of 200 frames show elapsed trajectories, and corresponding accumulated trajectories are shown in Movie S2 for LAMP1-HaloTag, SseF-HaloTag (live), and SseF-HaloTag (fixed), respectively. (D) Single-molecule tracks of singular trajectories from SseF-HaloTag and LAMP1-HaloTag were recorded in living cells over time. As a control, the diffusion of SseF-Halo-tag was monitored in fixed cells. Using at least 1,000 pooled trajectories of proteins from SIF structures in five infected cells recorded under the same conditions, the diffusion coefficient D was calculated using the Jaqaman algorithm.

