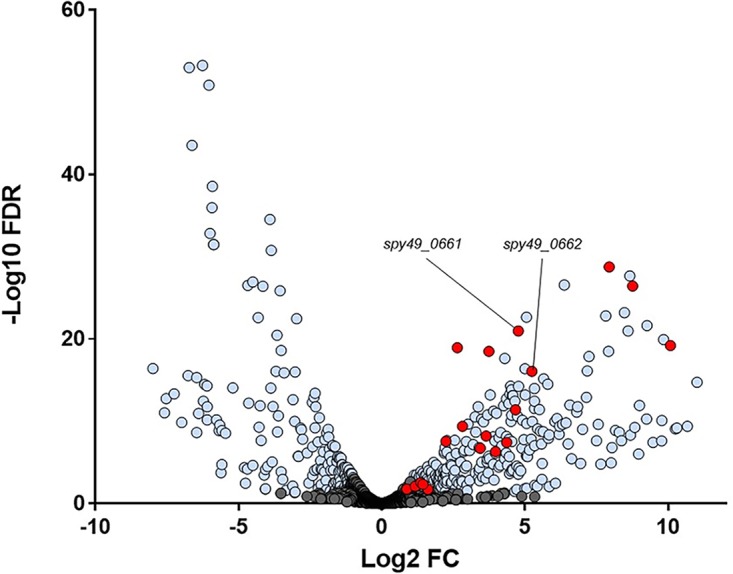
FIG 1.

Differentially expressed genes during GAS growth in vivo. The volcano plot shows transcriptomic changes in GAS genes during growth in liquid versus colonizing the murine vaginal tract with –log10 false-discovery rate (FDR) adjusted P value on the y axis and log2 fold change during murine vaginal growth on the x axis. Genes in blue were significantly differentially expressed with an FDR adjusted P value of <0.05 and a fold change of >2. Genes known to be regulated by the metal regulator MtsR are shown in red, and hupY (spy49_0661)/hupZ (spy49_0662) are specifically marked.
