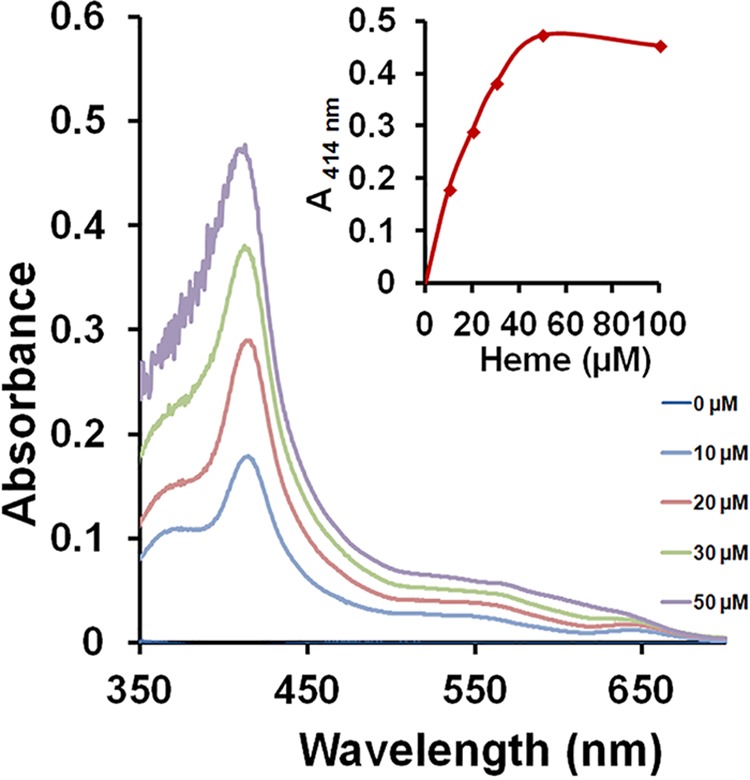
FIG 3.

Differential absorption spectroscopy of heme-HupY complex. An increase of heme bound to HupY (17 μM) as increasing concentrations of heme were added to the protein is shown by the sharp peak at 414 nm. The inset displays the changes in absorbance at 414 nm plotted against heme concentration. The data are representative of at least two independent spectroscopic analyses, 0 μM line at axis.
