
Figure 2.
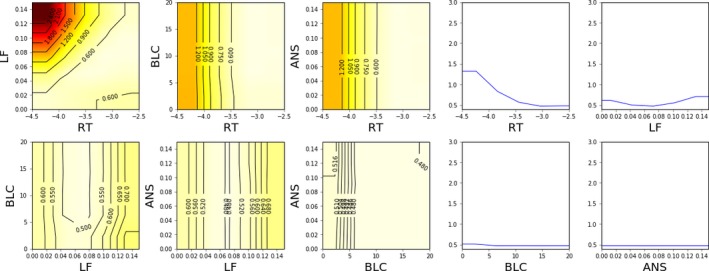
Estimated model fit (2D and 1D slices) near the optimum value (RT −3.0, ANS 0.06, LF 0.07, BLC 14.3) using grid search and 6 CPU‐hours of computation (625 model evaluations). Linear interpolation and constant extrapolation is used between sampled values. The color map is such that black is 3.0 and white is 0.4; lighter shades indicate better model fit. Contours are superimposed for additional clarity.