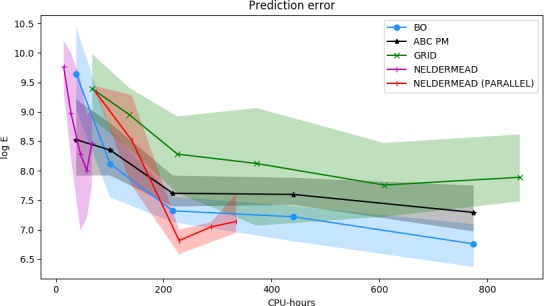
Figure 6.

Average model fit and confidence bounds for different point estimation methods as a function of the number of total CPU‐hours used. The shaded region indicates the area between the 25th and 75th percentiles. ABC PM is the ABC posterior mean; BO is Bayesian optimization. Each point is estimated using 10 independent experiments, except for parallel Nelder–Mead, which is simulated using the non‐parallel experiments.
