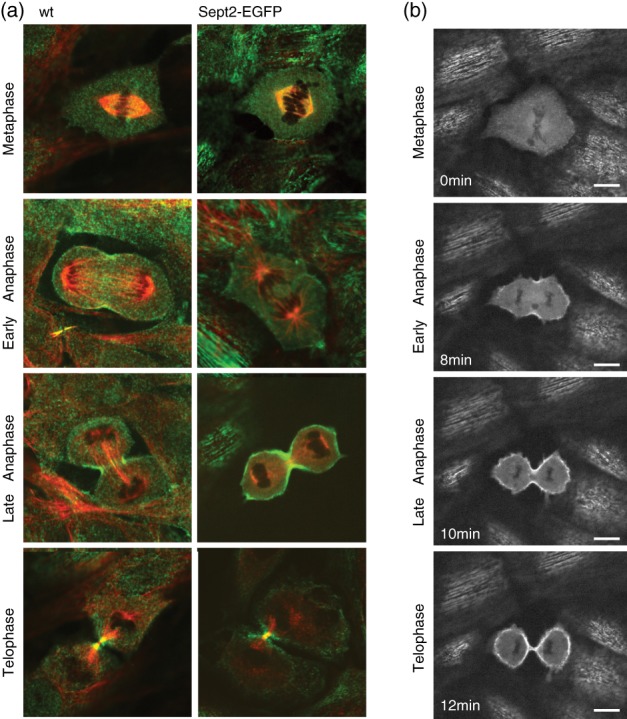
Figure 4.

Comparison of Sept2 distribution during cell division in wild type and genome‐edited cells. (a) Confocal images of wild type (left) and genome‐edited (right) NRK49F fibroblast cells in different phases of the cell cycle. Sept2 antibody and Sept2‐EGFP signal in green. Tubulin staining in red. (b) Individual frames from a live‐cell time‐lapse acquisition of dividing NRK49‐Sept2‐EGFP cells. Scale bars 10 μm
