Figure 2.

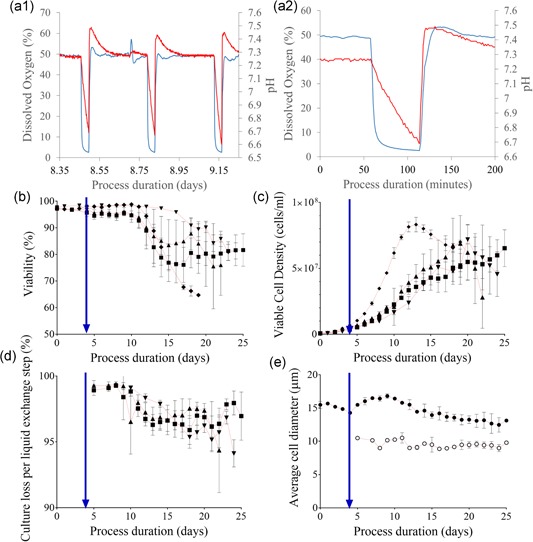
The response of the microscale system process pH and DO to cell settling, and the subsequent impact on cell growth and viability compared with bench scale operation. (a1) Sample traces from one microscale vessel in Experiment 1; inline DO (red) and pH (blue) measurements recorded during the process. Both parameters are plotted on their respective axes against the process duration (days). Variation in the acidity and oxygenation during one day of cultivation, which entails three exchange steps (1.0 VVD volume exchange rate), displayed the recovery between liquid exchange steps back to control set points. (a2) Zoomed view to one settling period from (a1) representing system response to cell settling and resuspension. (b) Viability (%) plotted against duration of cultivation (days) for the microscale vessels and the two bench scale reactors. (c) Viable cell concentration (cells/ml) plotted against process duration (days) for the microscale vessels and the two bench scale reactors. (d) Cell loss per liquid exchange step (%) determined as the ratio of the total cell content of perfusate to the total cell count for its respective culture suspended plotted against culture age. For (b)–(d): Microscale reactors: (▲) Experiment 1, n = 6 (30 min settling); (▼) Experiment 2, n = 4 (33.5 min settling); (■) Experiment 2, n = 6 (37 min settling); Bench scale reactors: (♦) Experiment 1, n = 2. Data show mean ± SD. (e) Average cell diameter (µm) plotted against process duration (days) for the cell samples in the microscale cultures (●) and in the perfusate (○). Plot represents the mean for all microscale samples (n = 16) with SD shown when the variation was greater than 3.5% of the mean. Perfusion initiation is indicated in each respective plot with an intersecting blue arrow. DO: dissolved oxygen [Color figure can be viewed at wileyonlinelibrary.com]
