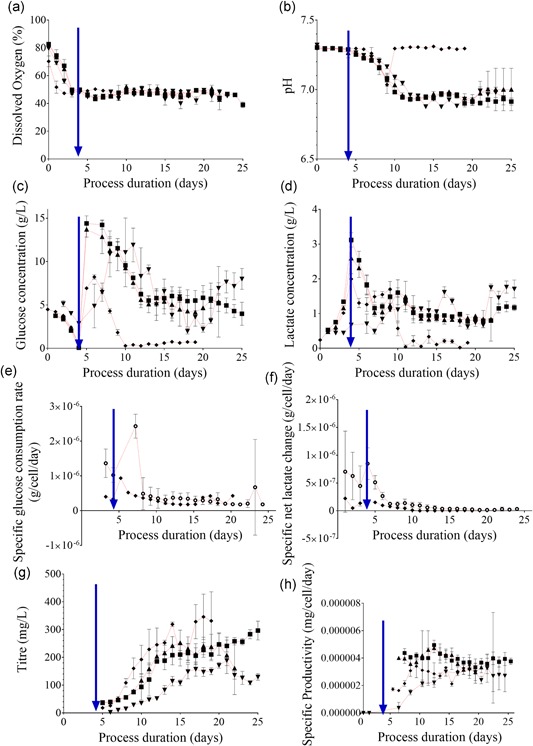
Figure 3.

Culture response in online and offline measured process parameters to the mode and the duration of cell retention. Online microscale vessel readings have been averaged over their respective 24‐hr periods to provide a representative value for the day. All parameters are plotted against process duration (days). (a) DO (%), online (b) pH, online (c) Glucose (g/L), offline (d) Lactate (g/L), offline (e) Specific glucose consumption rate (g/cell/day), (f) Specific net lactate change (g/cell/day), (g) Titre (mg/L), offline (h) Specific productivity (mg/cell/day). For (a)–(h): Microscale reactors: (▲) Experiment 1, n = 6 (30 min settling); (▼) Experiment 2, n = 4 (33.5 min settling); (■) Experiment 2, n = 6 (37 min settling); (○) combined microscale from Experiment 1 and 2, n = 16; (♦) Bench scale reactors: Experiment 1, n = 2. Data show mean ± SD. Perfusion initiation is indicated in each respective plot with an intersecting blue arrow. DO: dissolved oxygen [Color figure can be viewed at wileyonlinelibrary.com]
