
Figure 4.
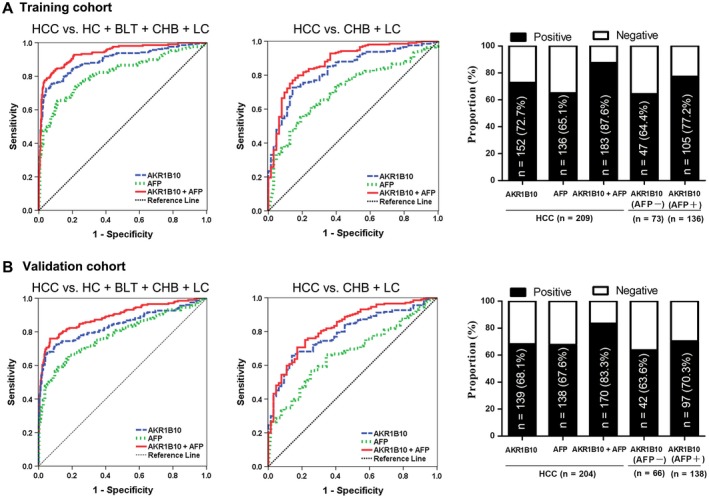
Serum AKR1B10 for detection of HCC. (A) Training cohort: ROC curves for HCC versus all controls (left); ROC curves for HCC versus high‐risk controls (CHB + LC) (middle); positive rates for AKR1B10, AFP, or both in HCC and for AKR1B10 by AFP status (right). (B) Validation cohort: ROC curves for HCC versus all controls (left); ROC curves for HCC versus high‐risk controls (CHB + LC) (middle); positive rates for AKR1B10, AFP, or both in HCC and for AKR1B10 by AFP status (right).