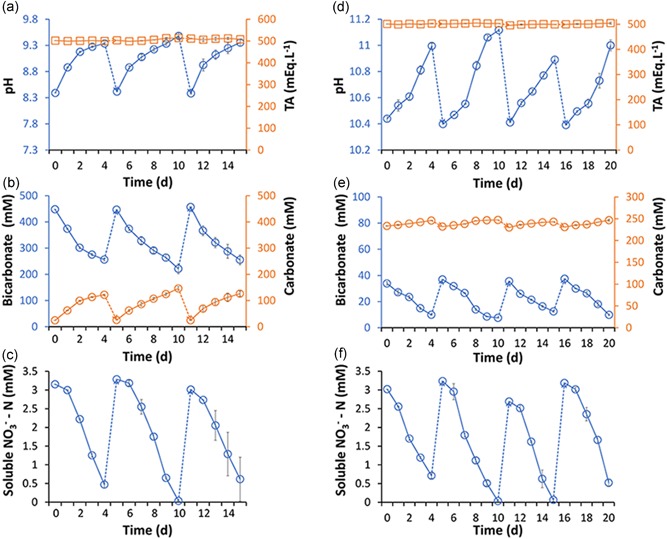
Figure 3.

Effect of pH on nitrate and bicarbonate uptake rates. (a–c) Shows three growth cycles with initial pH of 8.3. (d–f) Shows four growth cycles with initial pH of 10.4. Each cycle was performed in duplicates and error bars indicate the standard deviation [Color figure can be viewed at wileyonlinelibrary.com]
