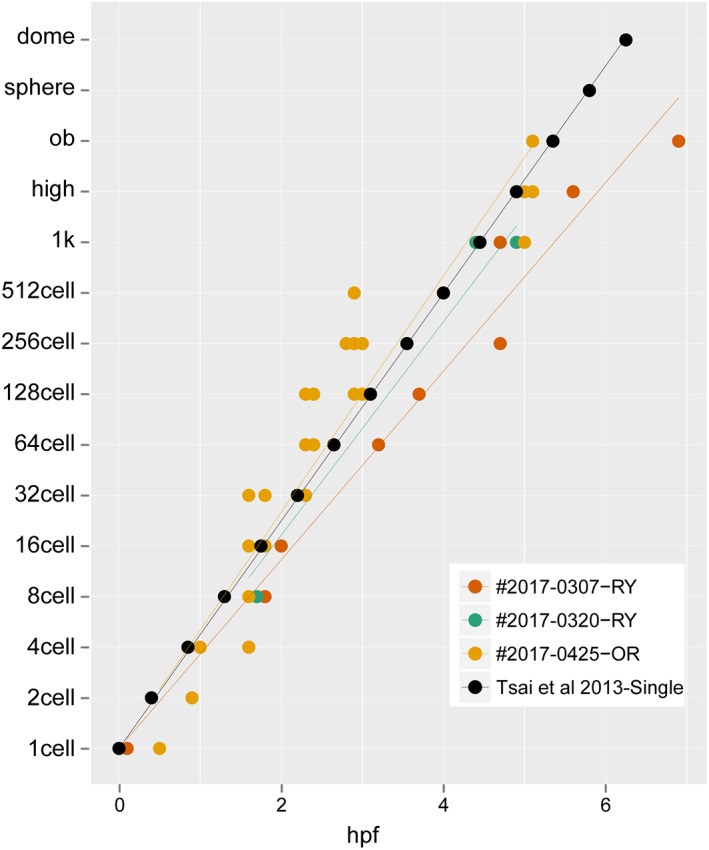
Figure 3.

Rates of development for embryos from zygote to early gastrula. The data were sampled from 87 points, consisting of 17, 9, and 61 points from #2017‐0307‐RY, #2017‐0320‐RY, and #2017‐0425‐OR clutches, respectively. The black circles indicate the rate of development for single‐tail goldfish reported in Tsai et al., 2013.
