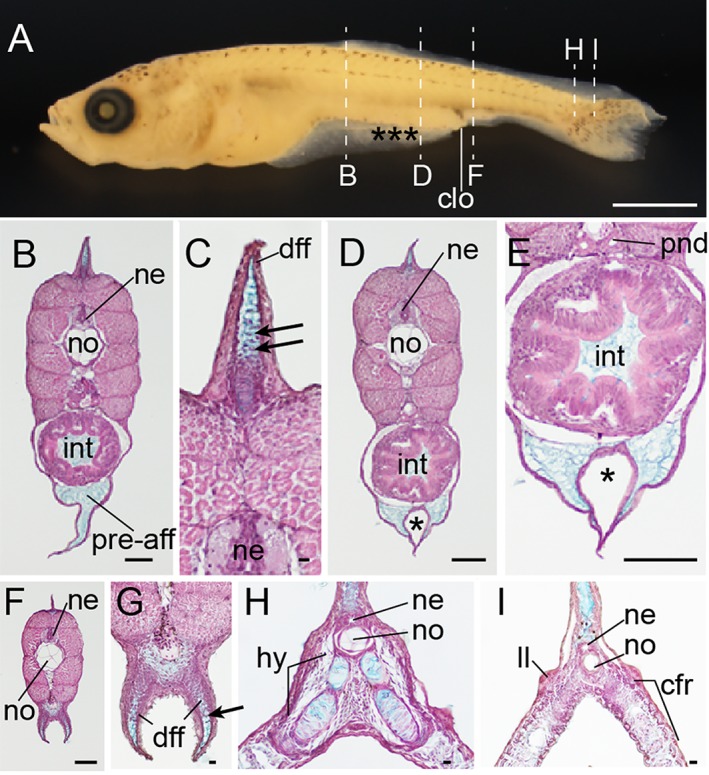
Figure 28.

Histological analysis of pre‐/postcloacal levels at Fcf stage. A: Whole‐body lateral view of fixed larva from Ryukin parents. B–I: Hematoxylin eosin and Alcian Blue–stained transverse sections. Panels C,E,G are magnified views of B,D,F, respectively. Locations of each section are marked by dashed white lines in panel A. Black asterisks indicate malformed areas of pre‐anal fin fold. Black arrowheads indicate migratory mesenchymal cells in dorsal and anal fins. cfr, caudal fin rays; clo, cloacal; dff, dorsal fin fold; hy, hypural; int, intestine; ll, lateral line; ne, neural tube; no, notochord; pnd, pronephric duct; pre‐aff, pre‐anal fin fold. Scale bar A = 1 mm. Scale bars B,D,E,F = 0.1 mm. Scale bars C,G,H,I = 0.01 mm.
