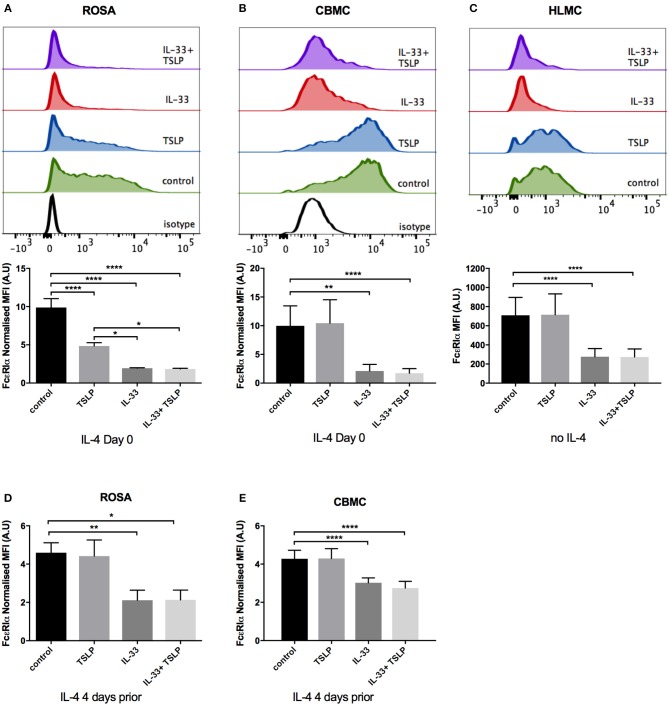
Figure 6.
Decrease in FcεRI surface expression by IL-33. ROSA cells (A,D), CBMCs (B,E), or HLMCs (C) were repeatedly treated every day for 4 days with 10 ng/ml IL-33, TSLP or a combination of both. In addition, IL-4 was added on day 0 (A,B) or 4 days prior to the addition of IL-33 and TSLP (D,E) to upregulate the FcεRI receptor. IL-4 was not added to HLMCs (C). Surface FcεRIα receptor expression was measured by flow cytometry; representative histograms are shown in (A–C) and quantification of the expression is shown below. The MFI of FcεRI was normalized to that of the isotype control. Data shown were pooled from 3 to 5 independent experiments, n = 6–10.

