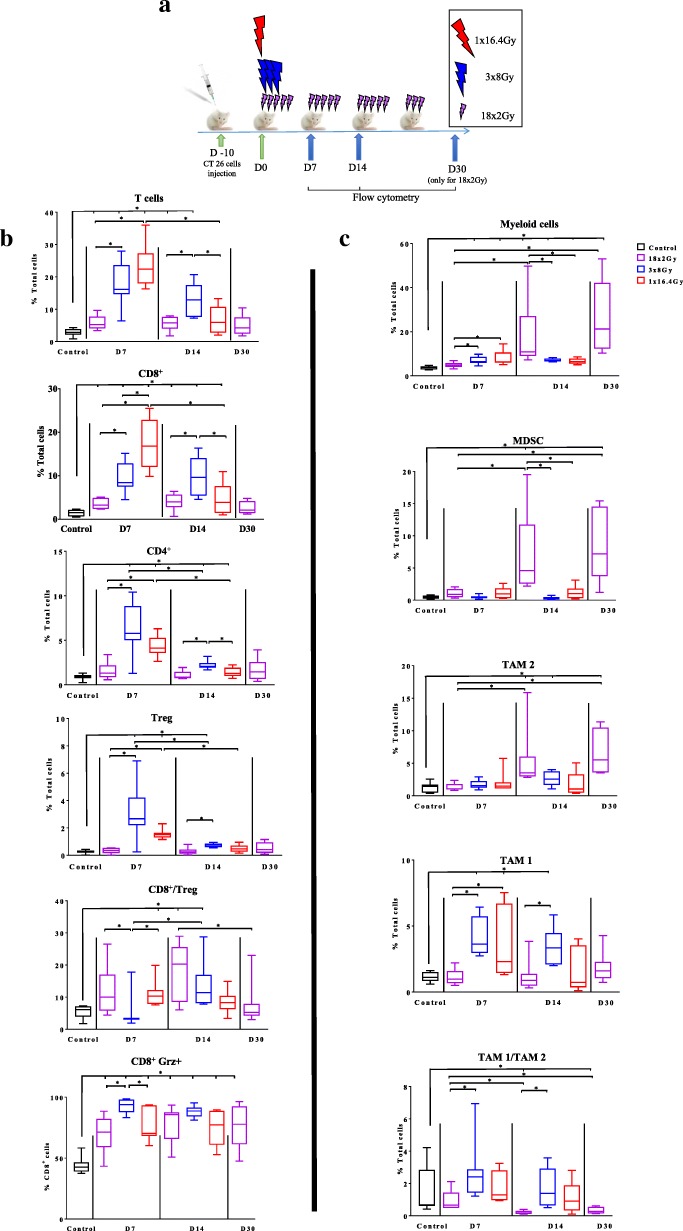
Fig. 2.
Immunomonitoring of lymphoid cells and myeloid cells after radiotherapy. Ten days after the injection of CT26 colon murine cancer, mice were assigned in 4 groups: control (at day 7), 1×16.4Gy (red), 3x8Gy (blue), 18x2Gy (purple) (a). Seven, 14 and 30 days after the beginning of RT, flow cytometry monitoring (FCM) was performed on dissociated tumors. Lymphoid panel analysis (b) including: T-cells, CD8+ T cells, CD4+ T cells, Treg T cells, CD8+ T cells/CD4+ T cells ratio, CD8+ granzyme+ (grz). Myeloid panel analysis (c) including: myeloid cells, myeloid-derived suppressor cells (MDSC), tumor-associated macrophages (TAM) 2, TAM 1, TAM1/TAM2 ratio. All data are shown with box and whiskers with min to max values obtained from 8 independent samples per point (duplicate, n = 8 per condition). *p < 0.05. Non-parametric Mann-Whitney test was used

