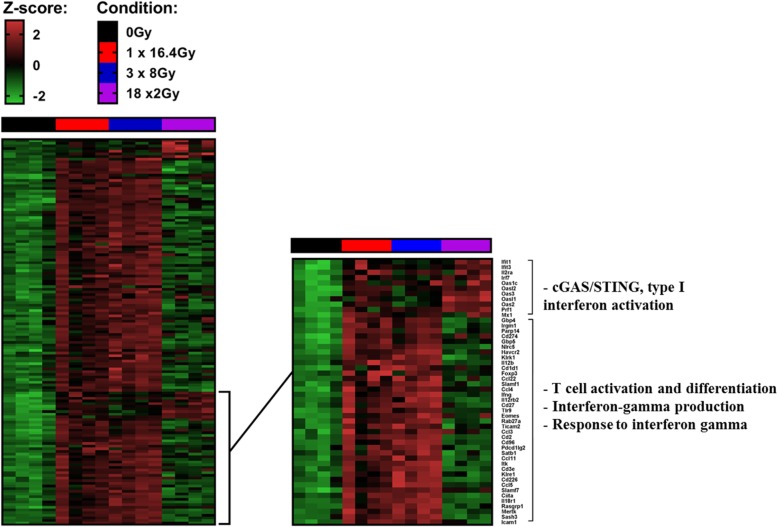
Fig. 3.
Heatmaps showing differentially expressed genes at day 7 after the end of treatment tumors (CT26 model) between at least one condition and control group. Illustration of gene expression with s-value < 0.005 and absolute shrink lock-fold change threshold of one (Z-score): control (black), 1×16.4Gy (red), 3x8Gy (blue), 18x2Gy (purple). Experimental groups contained 4 mice per condition

