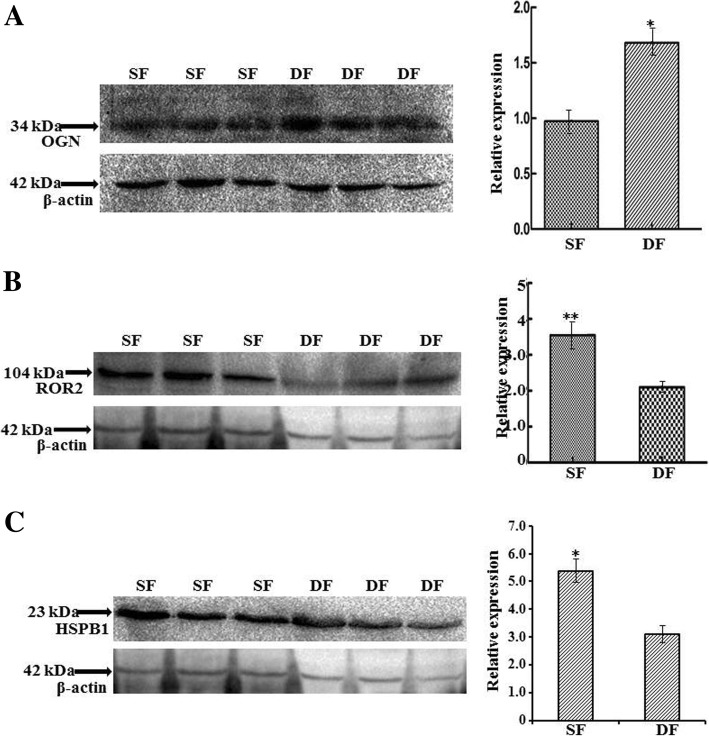
Fig. 4.
Western blots for validation of OGN, ROR2 and HSPB1 abundance in DF and SF. β-actin was used as a loading control, and the abundance of proteins was corrected relatively to β-actin. On the left side of a-c: immunoblot results of OGN, ROR2, HSPB1 and β-actin in DF and SF GCs; on the right side of a-c: protein relative expression level of OGN, ROR2 and HSPB1 in DF and SF GCs. Superscript single and double asterisk indicate significantly different at the 0.05 and 0.01 levels, respectively. (n = 3 each; least square mean ± SE)

