Fig. 1.

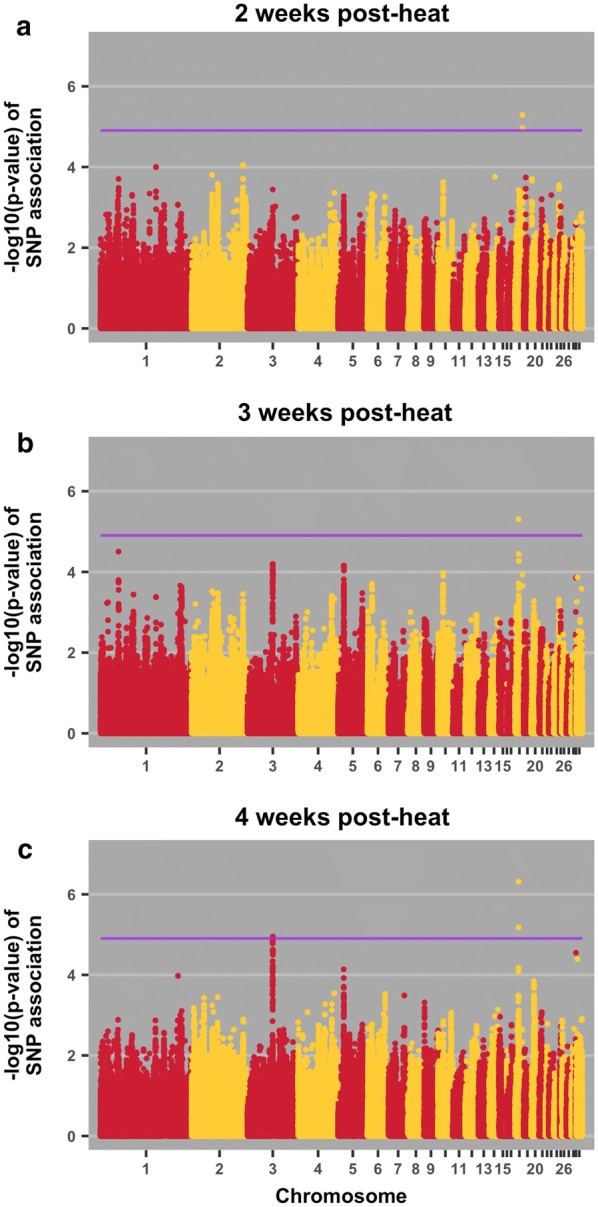
Manhattan plots for body weight 2 weeks (a), 3 weeks (b), and 4 weeks (c) post-heat initiation. The purple line indicates the 20% genome-wide threshold

Manhattan plots for body weight 2 weeks (a), 3 weeks (b), and 4 weeks (c) post-heat initiation. The purple line indicates the 20% genome-wide threshold