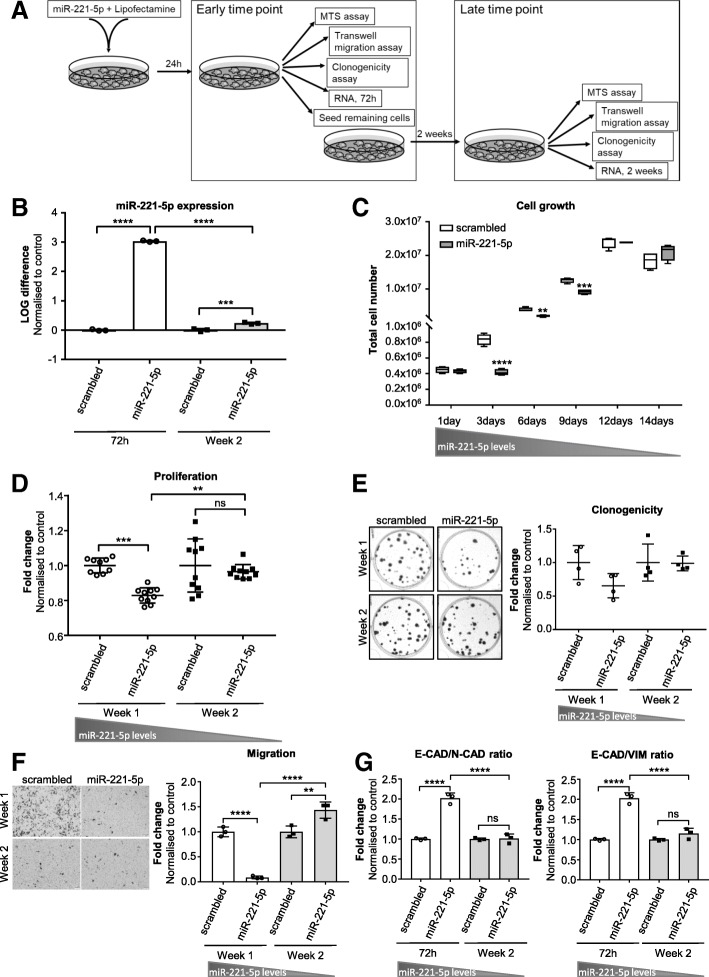
Fig. 5.
miR-221-5p-induced functional changes correlate to miR-221-5p (over)expression levels. a Experimental design of the rescue experiment after miR-221-5p overexpression. b miR-221-5p expression in PC-3M-Pro4luc2 cells 72 h and 2 weeks post transfection. miR-221-5p expression was normalised to housekeeping miRNAs and LOG difference to control (LOG(2-ΔΔCt)) is shown. Data are representative of n = 3 technical replicates and were analysed by one-way ANOVA with Tukey’s multiple comparison. *** p < 0.001, **** p < 0.0001. c Cell growth estimated by counting the total number of cells at different time points post transfection (1, 3, 6, 9, 12 and 14 days). Data represent technical replicates and were analysed by two-way ANOVA repeated measures with Sidak’s multiple comparison test. ** p < 0.01, *** p < 0.001, **** p < 0.0001. d MTS assay for proliferation of miR-221-5p or scrambled transfected PC-3M-Pro4luc2 cells starting 24 h or 2 weeks post transfection. Data of n = 10 technical replicates were normalised to T’0 h and fold change to scrambled at T’72 h was calculated. Data were analysed by one-way ANOVA with Tukey’s multiple comparison test. ** p < 0.01, *** p < 0.001. e Clonogenicity assay in PC-3M-Pro4luc2 cells overexpressing miR-221-5p or scrambled control at early and late time point. Data are representative of n = 4 technical replicates and fold change vs. scrambled represented. Data was analysed by one-way ANOVA with Tukey’s multiple comparison test. f Migration assay in PC-3M-Pro4luc2 cells overexpressing miR-221-5p or scrambled negative control at 1 and 2 weeks post transfection. The number of migrated cells was counted and the fold change to scrambled calculated. Data of technical triplicates was analysed by one-way ANOVA with Tukey’s multiple comparison test. ** p < 0.01, **** p < 0.0001. g E-CAD/N-CAD and E-CAD/VIM mRNA ratio of miR-221-5p and scrambled overexpressing PC-3M-Pro4luc2 cells. Data of n = 3 technical replicates are shown as fold change to scrambled and were analysed by one-way ANOVA with Tukey’s multiple comparison test. **** p < 0.0001

