Fig. 2.
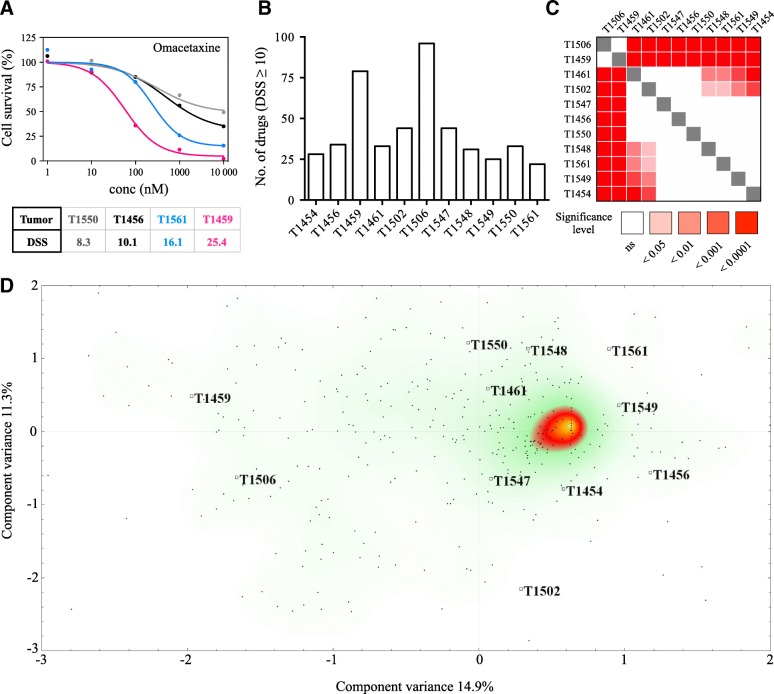
GSC sensitivity to anticancer drugs. (a) Presentation of four drug responses from the DSRT to the FDA-approved protein synthesis inhibitor omacetaxine. The dose-response curves and DSS demonstrate a drug response below the threshold defined as moderate activity (DSS ≥10) and three other responses with increasing efficacy from moderate to very strong. (b) Number of drugs from the DSRT in each GSC culture with a DSS ≥10. (c) Significance table of the distribution of the overall drug sensitivity to the drug collection (n = 461 drugs) in the primary GSC cultures. Using a non-parametric one-way ANOVA of ranks corrected for multiple comparisons, a significant difference was observed in the overall drug sensitivity (p < 0.0001). (d) Correspondence analysis of all drug responses displays a clear separation of the two most sensitive cultures along the first component variance (14.9%), whereas no identified pattern explained the spread of the cultures along the second component variance (11.3%). Each dot in the scatter plot represents individual drugs (rows), while individual tumors are highlighted (columns)

