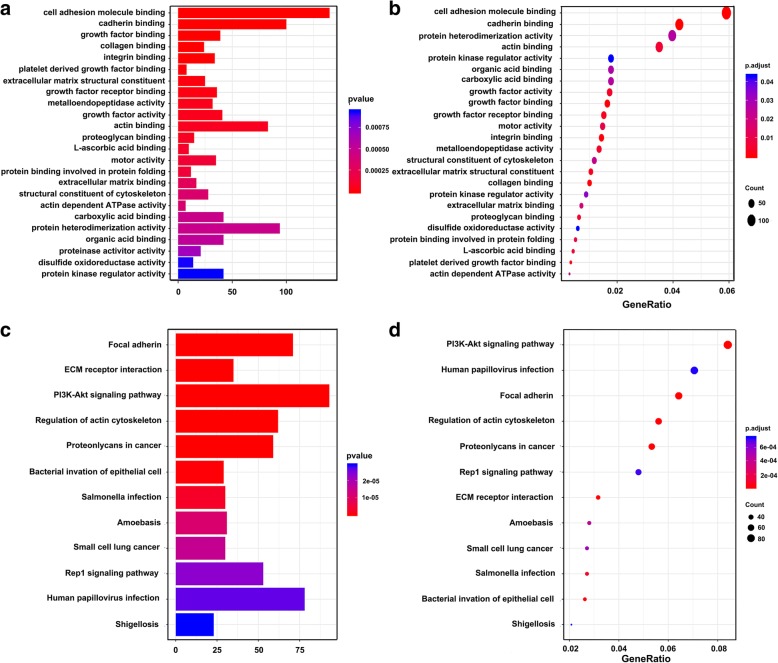
Fig. 2.
GO and KEGG pathway enrichment analysis for MYOSLID-related mRNAs based on TCGA data. a and b Plot of the enriched GO terms Go enrichment analysis for MYOSLID-related mRNAs. Y-axis represents the enriched GO terms; X-axis (a) represents the amount of the MYOSLID-related mRNAs enriched in GO terms; X-axis (b) represents the ratio of the MYOSLID-related mRNAs enriched inGO terms. b, c and d Plot of the KEGG pathways KEGG pathway enrichment analysis for MYOSLID-related mRNAs. Y-axis represents pathways; X-axis (c) represents the amount of the MYOSLID-related mRNAs enriched in KEGG pathways; X-axis (d) represents the ratio of the MYOSLID-related mRNAs enriched in KEGG pathways. The color and size of each bubble represent enrichment significance and the number of MYOSLID-related mRNAs enriched in a GO term or pathway, respectively. p < 0.05 was usedas the threshold to select GO and KEGG terms. GO, Gene Ontology; KEGG, Kyoto Encyclopedia of Genes and Genomes

