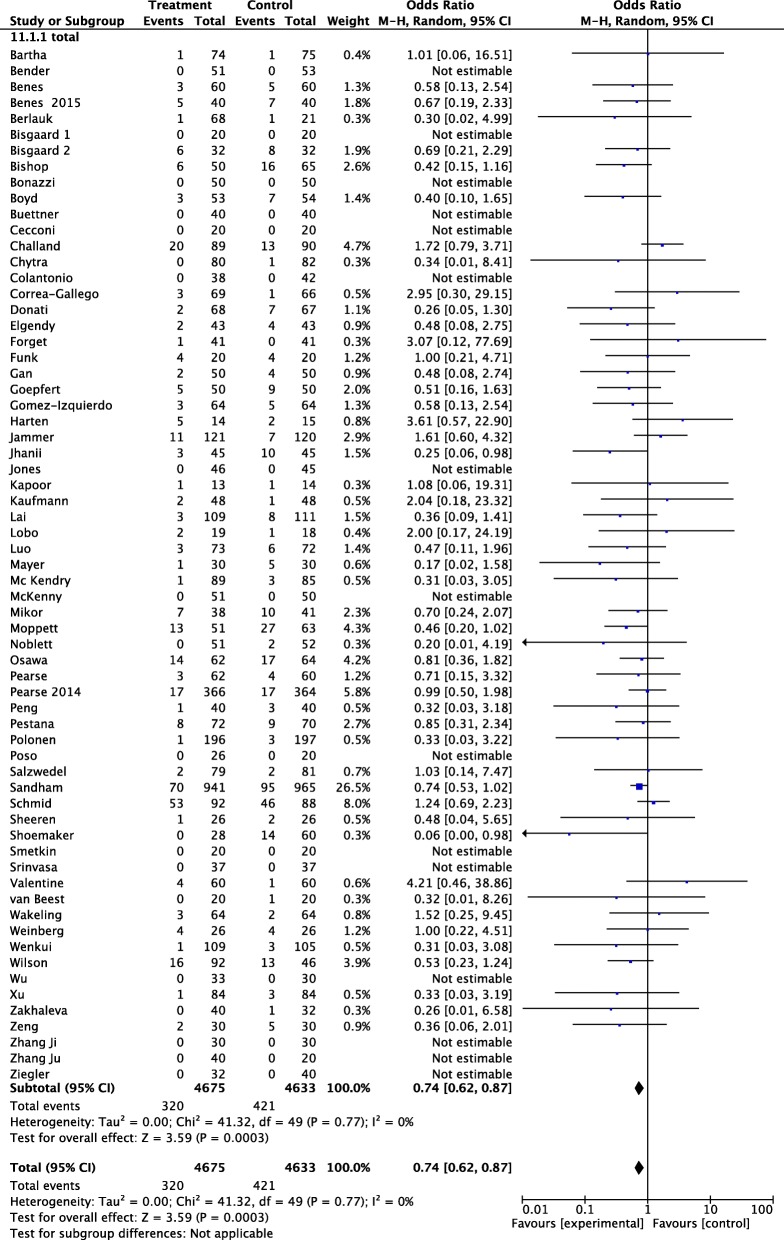
Fig. 1.
Forest plot for postoperative acute kidney injury (AKI) (defined as the proportion of patients who developed postoperative worsening of renal function, whichever definition was used). Size of squares for odds ratio reflects weight of trial in pooled analyses. Horizontal bars represent 95% confidence intervals

